Wednesday, October 13, 2010

Activity 10: Video Processing

A video is a dynamic version of an image.  In this activity, we performed image processing techniques to measure physical quantities of a physical phenomenon that happens in a video.

We we're able to perform image processing because of the concept behind a video.  A video is a result of successive images being flashed in a specific frame rate.  For humans, a frame rate of 30 will give a perception of real-time dynamics.

We studied the behavior of a pendulum swinging underwater and compared it to the same pendulum swinging in air.  These dynamics were captured using a camera at a frame rate of 30 fps or  $3.33x10^{-2}$ seconds interval for each frame.


Because a video is simply a set of images, we performed parsing of the videos taken using  a command-line free software (ffmpeg) into its image components.

The command used in ffmpeg to parse the video is shown below.

ffmpeg -i <video_file.avi> image%d.png

With the resulting set of images, we performed sequence of image processing to calculate the variables describing the motion of the pendulum.

1) We segment the images using parametric segmentation with the region of interest represented by the orange marker.

Segmented Harmonic Oscillation

Segmented Damped Oscillation

2) Because the segmentation detected some objects in the background, we performed masking to mask off the unwanted regions which were included in the segmentation.

3) We identified the image coordinate of the vertex of the pendulum and the location of the center of mass of the segmented ROI's so that we could compute using Eq. 1, for the angle of oscillation for each frame.

$\theta = \frac{x^, - x}{l}$   Eq. 1

where $x^, - x$  corresponds to the displacement of the pendulum from the x-axis for each frame and $l$ is the length of the string from the vertex to the ROI.

The computed values of $\theta$ was plotted against time (t) and the sinusoidal curve of the harmonic motion was achieved for the pendulum swinging in air Fig. 1 and the attenuating sinusoidal curve is observed for the oscillation of the pendulum underwater as shown in Fig. 2.

Figure 1:  Oscillation curve for the swinging pendulum in air.

Figure 2:  Oscillation curve for the swinging pendulum underwater.

From these results, we would like to compute for the value of the damping coefficient but for us to pursue with the computation we first verified if indeed we can gather correct physical parameters from our current results by trying to obtain a value of a physical constant which is the acceleration due to gravity.

With the equation for the period of the harmonic oscillation of a pendulum Eq. 2, we can derive the value of $g$.

$T = 2\pi \sqrt{\frac{L}{g}}$

where $T$ is the period of oscillation, $L$ is the length of the pendulum's string and $g$ is the acceleration due to gravity.  In our case the value for the period of oscillation is $T = 1.333 s$ and the length of the string is $L = 0.395 m$, thus we can compute for the value of $g$.  The computation gives $g = 8.776\frac{m}{s^2}$ having an error of 10.54% from the accepted value of $9.81 \frac{m}{s^2}$.  We can now say that indeed we can compute physical variables, thus we will continue to compute the damping coefficient in our system of underwater oscillation.

To be continued...

Activity 9: Stereometry

Depth perception in human is due to the separation of the human eyes.  Each of the eye receives a signal which seems to be exactly the same with the other eye, but actually both signals report differences in details of objects seen by each of the eye.  One of the differences in the signals received by each eye is what the brain interprets to be the depth of the object .

Stereo imaging technique is one of the methods used in 3D imaging.  This specific imaging technique is inspired by the mechanism on how a human eye can perceive depth [1], Fig. 1.

Figure 1:  Illustration for stereo imaging [2].
Because of this inspiration, just like a human eye, this technique requires 2 imaging devices whose image information will be interpreted to perceive the depth of the object taken in the image.

In our case, because we don't have two identical cameras to be able to capture the object simultaneously, we used only one camera and took two images of the object wherein the second image was taken after the camera was displaced a distance $b = 2.54$ cm along the x-axis from the location where the first image was taken making sure that no rotation in the camera was made, Fig. 2.
Figure 2:  Images of the same Rubik's cube produced before and after translation of the camera.

The object which we used for this activity was a Rubik's cube.  After taking the images, we take the image coordinates of the intersection of the blocks in the visible edges of the Rubik's cube to be used in the reconstruction.

From the previous activity we can derive the focal length of the camera using RQ-factorization but here, we did not perform this intermediate method because the value of the focal length of the camera used was given in the properties of the image which is $f = 4.7$ mm.

Using the equations [2],


we have recovered the real-world coordinates of the points sampled in the images.  The expression in the denominator for the z-real-world coordinate is called the disparity.

We plotted the 3D reconstruction of the Rubik's cube and resulted to the surface plot as shown in Fig. 3.


Figure:  3D reconstruction of the Rubik's cube using stereo imaging technique.

Based on the result of the reconstruction, we have concluded through qualitative comparison that the reconstruction has a high resemblance with the object of interest (i.e. Rubik's cube).


Code:


Sources:
    [1] Dr. Maricor Soriano - Applied Physics 187: Activity 9 Manual
    [2] Introduction to Stereo Imaging - http://www.cs.cf.ac.uk/Dave/Vision_lecture/node11.html


Activity 8: Camera Calibration

The formula for deriving the necessary parameters in camera calibration is given by the solution of Eq. 1.

Equation 1


From the values of the coefficients derived from this equation, a formula for acquiring the value of the image coordinates given its associated real-world coordinates can be derived given by Eq. 2 and Eq. 3.


Equation 2

Equation 3

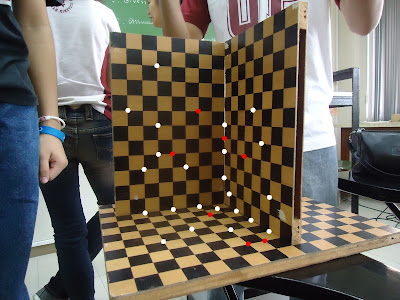
In this activity which tackles the method of camera calibration [1], we used a checkerboard at right angle placed above another checkerboard as illustrated in Fig. 1.

Figure 1:  Checkerboard used for the camera calibration.

From this setup, we take sample pictures using a camera to be calibrated.  We chose an image and we selected certain points in the image plane to be used in the calibration denoted by the white dots in Fig. 2.  These points will be inputted to the camera calibration formula so that the calibrating parameters will be known.

Figure 2: 

The camera calibration formula requires the coordinates of the reference points both in the image coordinates and the real-world coordinates.  The resulting parameters should allow the person to know the value of the image coordinates of the region of interest given the real-world position ,and vice-versa.

We performed the camera calibration and we yield values for the coefficients as shown in Table 1.

Table 1:  Computed coefficients using the camera calibration formula.

We used these coefficients as parameters in Eqs. 2 and 3 to predict the image coordinates of known points in the image marked by red colored dots in Fig. 2.  This was done to ensure the correctness of the derived coefficients.


Table 2
 
Table 2 summarizes the results of the predictions which verifies the accuracy of the derived coefficients from the camera calibration formula.  The errors in the prediction never exceeded 1%.


Code:


Sources:
    [1] Dr. Maricor Soriano - Applied Physics 187 - Activity 8 Manual

Activity 5: Measuring the Gamut of Color Displays and Prints

The term gamut technically originated from music [1].  It means that the set of pitches of which musical melodies are composed.  In Physics, gamut is the range of chromaticities that can be obtained by mixing three or more colors.  The gamut of a device or process is that portion of the color space that can be represented or reproduced.

Gamuts are generally represented as area in the CIE diagrams, the higher the area of the gamut, the larger the numebr of the colors present in that device.  Shown below are the spectra measurements of red, green and blue LCD.


Gamuts of the LCD and printed colors are presented below.

Gamut representing the spectral range of an Asus laptop LCD.

Gamut representing the spectral range of a Canon printer.

Gamut representing the spectral range of an Epson printer.


Below are the spectra measurements of printed cyan, yellow and magenta.


Sources:
    [1] Dr. Maricor  Soriano - Applied Physics 187:  Activity 5 Manual

Tuesday, October 12, 2010

Activity 3: Familiarization with Light-Matter Interaction


An interaction of light and matter will result in an optical phenomenon. There are different forms of optical phenomena, an example of it are scattering, diffraction, interference, reflection and transmission of light.


Diffraction:
Diffraction is defined as the change in the directions and intensities of a group of waves after passing by an obstacle or through an aperture whose size is approximately the same as the wavelength of the waves. The bending and spreading of light on small obstacles are some characteristics of diffraction. Images shown below are examples of diffraction of light-matter interactions.

 Figure 1:  Example of Diffraction (Light entering and leaving a glass prism) [1].


Interference:
The superposition of two or more wave that produces a new pattern is called interference. Interference occurs in two forms, constructive and destructive interference. Constructive interference is when the superimposed waves are in phase resulting to a summation of amplitude. Meaning, the troughs and peaks of the waves are lined up. On the other hand, destructive interference is when the troughs and peaks of the waves are out of phase which means the sum of their amplitude goes to zero.

Figure 2:  Example of Interference (Hologram) [2].


Reflection: 


A light scattered in the opposite direction of incident light is defined as reflected light. The law of reflection states that the angle of the incident ray is equal to the angle of the reflected ray with respect to the normal of the medium. Shown below is representation of the law of reflection.


Reflections of light can either be specular (glossy), body (matte) or inter-reflection depending on the nature of the interface. Below are the examples of reflections.

Specular reflections are almost the same as a light reflected on mirrors.

Body (matte) means that the object will not be directly visible in the scene; instead, the background color will be shown in its place. However, the object will appear normally in reflections/refractions and will generate indirect illumination based on its actual material

Inter-reflection is the phenomenon the occurs when a reflection of others objects are seen in the object of interest.


Transmission:
Transmission is the act of passing something on in another place. Transmission is the property of a substance to permit the passage of light, with some or none of the incident light being absorbed in the process.


Images Exhibiting Specific Light-Matter Interaction Phenomena

Body (Matte):

Diffraction:


Specular:


Transmission:


Interreflectivity:

Sources:
    [1] http://electron9.phys.utk.edu/phys136d/modules/m10/geometrical.htm
    [2] Credits to Dr. Percival Almoro and the Photonics Laboratory for the imaging.
    [3] Mulan - Reflection - http://www.youtube.com/watch?v=5A_Rl8aQxII
    [4] http://en.wikipedia.org/wiki/Specular_reflection

Activity 2: Familiarization with Properties of Light Sources

Familiarization with Properties of Light Sources

Light, as defined by physics, exhibits properties of both waves and particles.  It propagates at speed of approximately 3x10⁸ m/s [1-3].

In this activity, we measured the emittance spectrum of different light sources. In our case, we measured the red, green and blue spectrum of the screen of TOSHIBA Satellite L510 model.  Then after that, simulated a blackbody radiation that has a temperature that ranges from 1000 Kelvin to 6500 Kelvin.  We will be analyzing the spectral emittance of various objects.  This phenomenon is dependent on temperature and the wavelength as given by the Planck's Equation in Spectral energy Density Form defined as,


Eq.1: Planck's Equation in Spectral Density Form

by the Planck's Equation in Spectral energy Density Form defined ,where h is the Planck's constant having a value of 6.62608 x 10⁻³¹ Js, λ is the wavelength of radiation, c is the speed of light, k is the Boltzmann constant which has a value of 1.3806503 × 10⁻²³ m2 kg s-2 K-1 and T is the temperature in Kelvin [4].

From (Eq. 1), we can theoretically say that as we increase the temperature, the spectrum shifts to the lower wavelengths.  Meaning, the blackbody shifts to the UV part as the temperature increases.

 
Results and Discussions:
Using the spectroradiometer, we measured the emitted spectra of the laptop screen.  Shown below is the plot of the three spectra namely red, green and blue.

Fig. 1: Spectra measurement of red, blue and green from the screen of the laptop.

From this plot, it is clearly evident the separation of colors taken from the screen of the laptop.  The blue line is the measurement of the spectrum of the red background of the screen.  It shows that the curve produced is near to the standard wavelength of red which is 632.8 nm, we think that the extra peak from this curve is due to the light produced from the screen of the laptop.  On the other hand, the red curve is the measurement of the spectrum of the green background and the green line is the spectral measurement of the blue background.  Both are near the standard wavelength of green and blue respectively.

Other measurements were done on different sources.  Shown below are the measurements of fluorescent, incandescent lamp and oven.

Fig. 2: Spectra measurement of a fluorescent lamp.


Fig. 3: Spectra measurement of an incandescent bulb.


Fig. 4: Spectra measurement of an oven.

It can be observed that the resulting spectra of the fluorescent lamp seems to be the convolution of the spectrum of the mercury vapor and the fluorescence of the phosphor in the lamp.  On the other hand, the broad peak observed from the incandescent bulb corresponds to the yellowish color that it emits.  Lastly, there is no conclusive argument for the measured spectrum for the oven because the signal is noisy.

Next is the simulation of the blackbody radiation.


Video clip1: Simulation of Planck's Blackbody Law.

Aivin, simulated the blackbody radiation and it was seen that from the video clip, as the temperature increases, the emittance of the blackbody shifts to the UV wavelength.  In layman's term, the blackbody turns to blue and becomes brighter as the temperature increases.

References:
    [1] http://dictionary.reference.com/browse/light
    [2] http://en.wikipedia.org/wiki/Light
    [3] http://www.physics4kids.com/files/light_intro.html
    [4] Soriano, M., Applied Physics 187 Handouts, "Activity 2:  Familiarization with Properties of Light Sources". 2010.

Saturday, September 25, 2010

Activity 1: Sensing Properties of the Human Eye

We’ve been gifted with the sense of sight. The human eye provides us to see a glimpse of the wonderful universe we’re living. Because of our eyes, we were able to appreciate the beauty of every living organism, architectural designs and our loved ones.

Curiosity arises in the human race. Scientists tend to discover the laws of nature, investigate on different behaviors, etc. For years and years, scientists have produced vital contributions for the development of our lives. The eye for example, scientists have studied its anatomy and physiology. In terms of physics, the human eye is considered as a simple lens.

Today out of our curiosity, we will perform different tests to observe the sensing properties of our eye. The table below shows the minimum focus distance of our eyes. Left and right eyes were also tested independently.

Table 1:  Minimum focus distance of the subjects.

The measured distances were acquired just before the individual was not able to read the object using a tape measure. The data shows that the human subjects’ eyes have a focus of 14 and 11 cm respectively. Upon testing individual eyes, we can say that each side has its own focus.

The second test that we did was to check our maximum angle of peripheral vision. Each eye will be tested with different pen orientations. Table 2 shows the results of aiming the maximum peripheral vision.

Table 2:  Maximum angle of peripheral vision for the test subjects.

According to Ma’am Jing, chicken eyes have peripheral vision of more than 90 o. So, are we to conclude that Aivin and I have the sight of a chicken? HAHA. This was done by placing a thread to a vertical and horizontal pen connected with a protractor which is centered at the desired eye to be tested. We have concluded, in our case that we have a wide range in our peripheral vision. We can see you if you are located approximately 100 degrees behind us.

The table below shows the vertical and horizontal distances of the reader towards the object. From those distances, we will be able to obtain the visual acuity of the person. Visual acuity, in this activity, is defined as the maximum angle until the reader could not recognize the letters any longer. We could use the right triangle formula in order to get the visual acuity of the individual.


Table 3:  Visual acuity corresponding to the test subjects.

We considered the vertical distance as the distance of the object to the viewer while the horizontal distance is from the target letter to the letter last recognizable. From that judgment, the opposite side would be the horizontal distance and the adjacent side would be the vertical distance. Jonats’ visual acuity is 2.24 degrees while Aivin’s is 1.69 degrees.

The last table shows the colors perceived by Aivin and Jonats and the two volunteers namely Shua and Celina as they exposed themselves to a dark place. The colors are randomly arranged inside the garbage plastic and will be perceived as light is introduced inside the room.

Table 4:  Results for the scotopic and photopic vision test for each of the test subjects.